
Next: Activation and inactivation of Up: LOGGER ver.4.1. - USER Previous: Activation and inactivation of Contents
``WUG'' Displaying mode
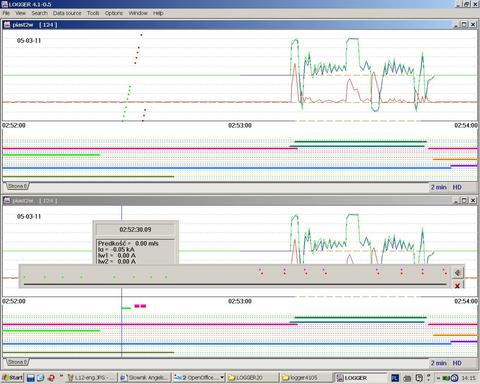
This displaying mode is destined to viewing the graphs in two-minutes periods. The single stroke signals are drawn directly on the chart. Horizontal time axis (x-axis) is destined for analog and binary signals' charts, while the vertical (y-axis), apart from being analog signals' amplitude scale, is a five-seconds time axis for single stroke signals. Two methods of displaying single stroke signals series are shown on fig. 11.1.
Subsections
